Space. Intelligence. Energy.
Satellites, sensors and energy, connected to your farm.
Measured savings, not forecasts.
One Aerospace Canada builds a data and monitoring platform for irrigated farms. It connects satellite imagery, field sensors and machine telemetry to the energy that runs the farm, and reports the result in litres of diesel, cubic metres of water and kilowatt-hours per hectare.
Platform in development · pilot conversations open
Calgary, Alberta Subsidiary of One Energy Canada Inc. Incorporated Sept 2026
Weather & satellite
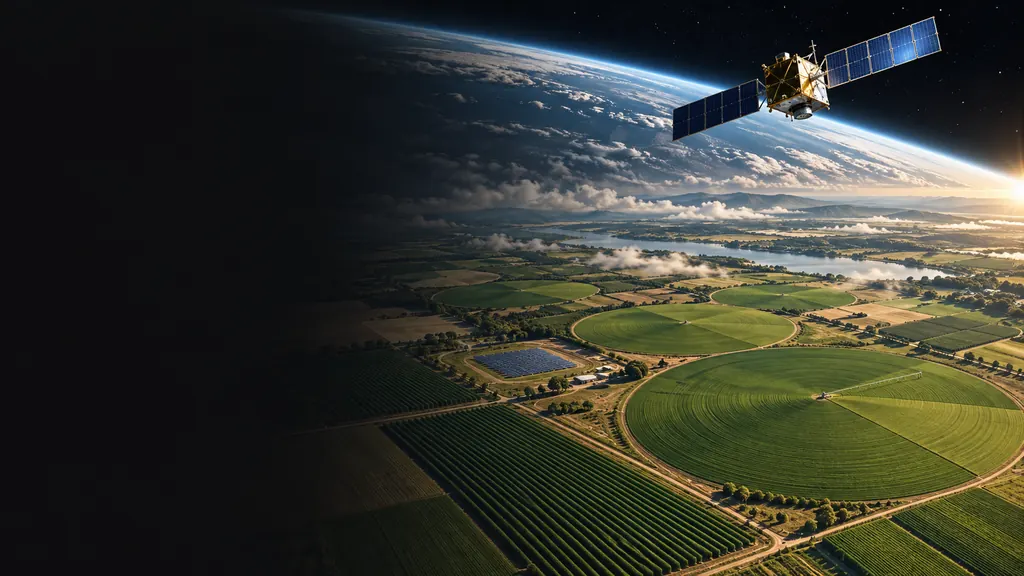
Conceptual illustration, AI-generated
The problem
Water, fuel and energy in the same decision.
Water, fuel and energy need to be part of the same decision. One AgroGrid is being developed to bring together crop data, sensors, telemetry and energy sources, to support planning and the measurement of cost per hectare.
Whether to run a pivot tonight depends on the soil, the forecast and what the energy costs at that hour. If that energy comes from a diesel generator, the decision also shows up in the fuel tank. Bringing those answers into one view, per pivot, is what the platform is for.
Crop
Where the field varies
Imagery, soil sensors and scouting show where to look and how much to apply.
The decision
When to pump, and at what cost
Soil moisture, forecast, fuel and power price considered together, per pivot. This is what One AgroGrid is working on.
Energy
Where each kWh comes from
Grid, solar, battery or generator: the source changes the cost of every pumping hour.
One AgroGrid

One platform, five layers.
A farm can start with one layer and add the rest as it needs them. Each layer has the colour of the data it carries. Select a layer to see it on the pivot.
What the satellite sees
What the satellite sees, and what it doesn't.
Satellites don't see insects. They see stress, and by the time stress shows up in the image, the damage has already happened. The forecast comes from the weather model. The image doesn't replace the agronomist. It tells them which field to walk first.
It can show
- Differences in canopy vigour across a field, on passes where cloud allows an optical reading.
- Variations that can guide a field investigation, such as possible stand gaps, depending on image resolution and crop.
- Zones that behave differently season after season, useful for variable-rate application.
- Support for checking the area of an operation, when image resolution and date allow. The area itself comes from the machine track and the field boundary.
It can't show
- Insects, eggs or spores. It sees the crop's response to them, later.
- The cause of stress. Water, nutrients, disease and pests can look alike from orbit.
- Reliably, what is under cloud. Clouds can prevent optical imagery from being read. Radar imagery can complement some analyses, when available and suited to the purpose. Different sources measure different things and don't replace a field assessment.
- A diagnosis. That still needs a person in the field. Early detection with hyperspectral sensors is research work and will only be offered as a pilot with partners.
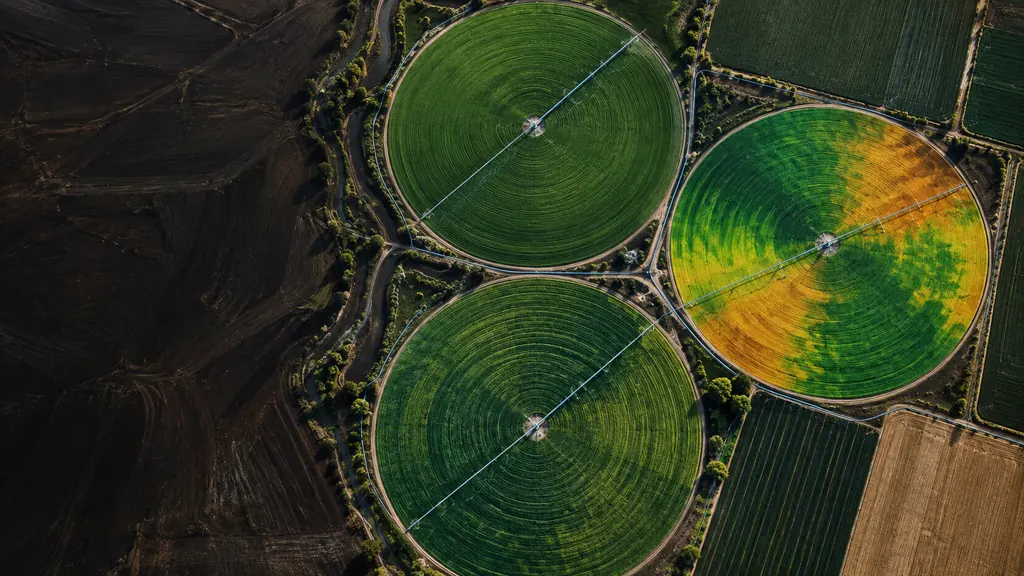
The satellite says where to look. The weather model says when to worry. The agronomist decides.
How the number is built
Litres per hectare, calculated and reconciled.
The calculation is simple: litres assigned to the operation divided by the area of the operation. Reconciling that total with what left the tank reveals discrepancies, such as fuel that left without a machine assigned. It doesn't prove every litre, and it doesn't prove a loss or fraud. It turns a self-reported figure into one that can be checked.
Tank sensor
Measures the diesel that actually left the tank. It also catches refuelling events and drops that don't match any refuelling or any machine.
Machine telemetry
Assigns that fuel to a machine and an operation, in litres rather than engine hours. It works on mixed and older fleets that factory telemetry doesn't cover.
Area of the operation
Checked against the machine's own track and the field boundary, instead of taking it from the logbook alone. Satellite imagery is extra support when resolution and date allow.
Pumping simulator
What one pivot season takes to pump.
Enter your pivot and your energy source. The simulator works out the water, the energy and the fuel from physics, so you can see the size of the numbers the platform would measure.
Water = area × depth × 10
Energy = water × head × 9.81 ÷ (3,600 × efficiency)
Diesel = energy × generator L/kWh
An estimate from your inputs. It is not a quote, a design or a savings result. The platform replaces these assumptions with measured values.
Next
Find your farm on a satellite map, place your pivots, and get a summary with area, solar resource, rainfall and soil texture for that spot. In the meantime, the weather centre shows recent satellite imagery for your region.
Case studies
Results only with permission and measured data.
This space will hold case studies from pilots, published only with the grower's permission and with the measurement method described. No case studies have been published yet.
Who is behind it
Built on top of a group that generates the energy.
One Aerospace Canada Inc. is a wholly owned subsidiary of One Energy Canada Inc., part of the One Energy Group. The group builds and operates solar, storage and microgrids for irrigation. One Aerospace adds the data layer on top.
Most farm software reports energy use. The group behind One AgroGrid builds and operates the generation itself. The platform was designed around a hybrid irrigation plant operated by the group: roughly 3 MWp with diesel generators and batteries driving centre pivots. It was designed around a working site, not in a lab.
One Aerospace Canada is a data, monitoring, sensor-integration and software company. Where a job requires a licensed professional, we work alongside licensed professionals.
└─ One Energy Canada Inc.
└─ One Aerospace Canada Inc. · 100% owned
One Energy Group, all entities
These figures belong to the One Energy Group. One Aerospace Canada was incorporated in 2026 and has no project history of its own.
Talk to us
Tell us about a real farm.
Tell us the crop, the pivots and where the energy comes from. We'll answer plainly about what the platform would change and what it wouldn't. Start with the quick check below, then email us. Add the simulator figures if you like.
Paste the farm check summary into your email. You'll get an answer from a person, not an automated sequence. If you'd rather not use email, call or text +1 587-717-1013 (mobile, Canada).
Ask about your farm
An AI assistant that knows what the platform does and doesn't do. It reads your farm check and the simulator above. It answers in English or Portuguese, and it won't quote prices or promise savings.
Uses your own Claude account and asks your permission the first time. Answers are general guidance, not a proposal or a quote.